
Every 15 minutes a household becomes homeless in Scotland because of the housing emergency.
Scotland housing and homelessness statistics
Scotland's new parliament
We believe that change to Scotland’s housing system is needed now, more than ever.
That is why we are calling for urgent action. Scotland needs:
15,693 social homes every year to begin reducing homelessness
a new national housing agency focused on reducing affordable housing need
delivery of the funding that local authorities need to uphold people's housing rights and move out of systemic failure
a clear restatement that people's lifeline housing rights are not going to be rolled back
You can read our key policy asks in full in our 2026 Delivery Plan.
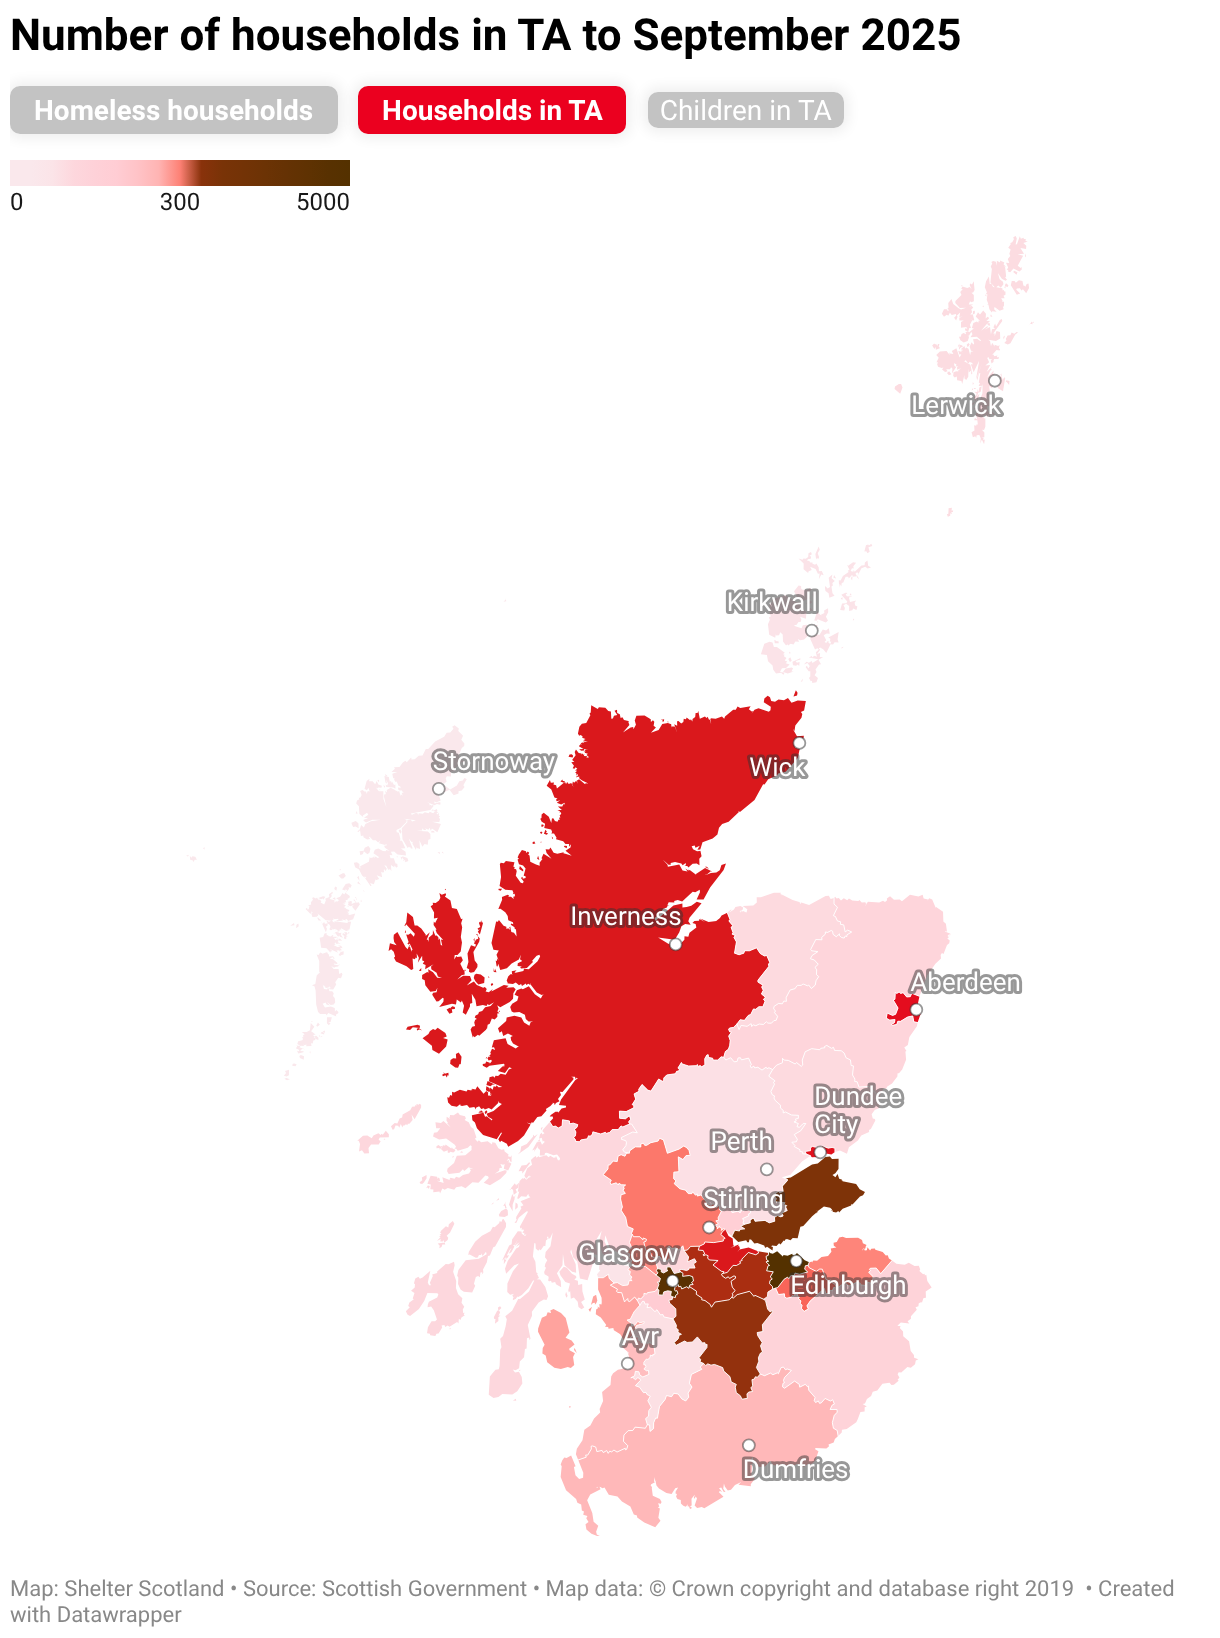
Explore our interactive map of homelessness in Scotland
Our interactive map allows you to explore the temporary accommodation (TA) and homelessness data for each local authority area.
Click on the buttons below to see 3 maps showing local authority data, including the percentage change since last year, for:
the total number of households who are homeless
the number of households in temporary accommodation (TA)
the number of children in temporary accommodation (TA)
Homeless applications
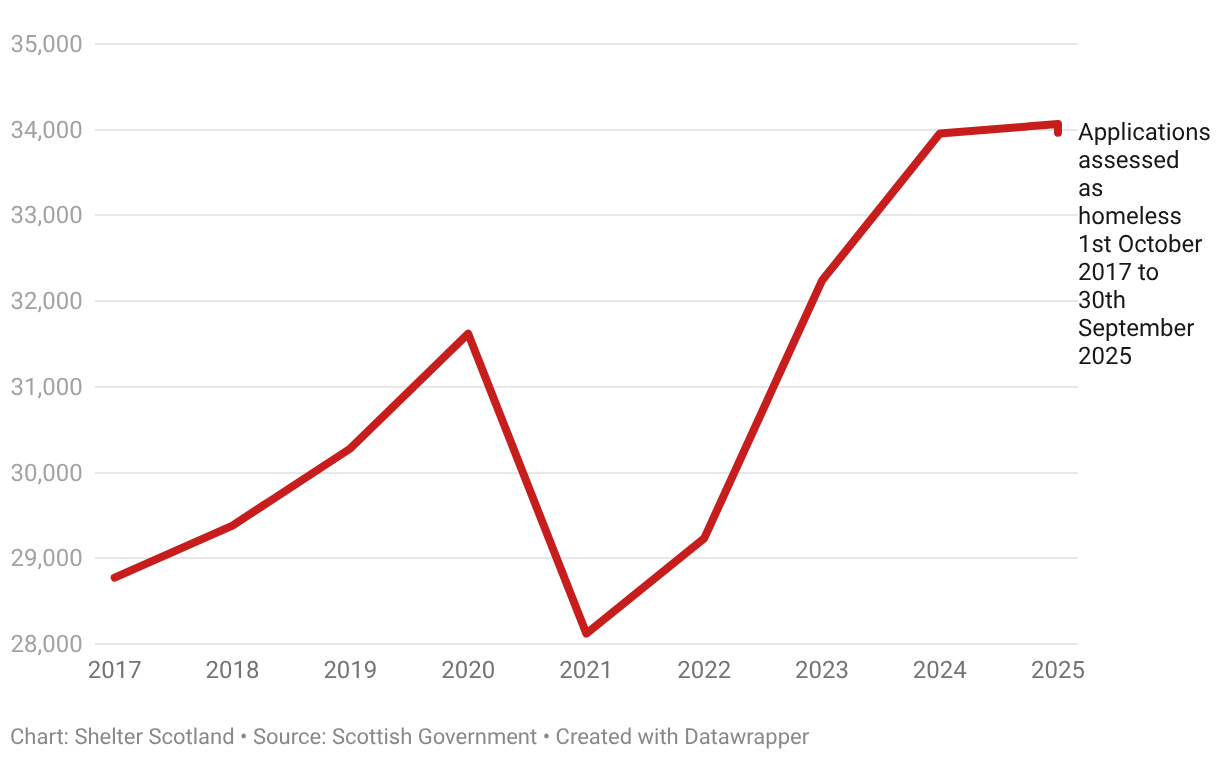
There were 33,966 households assessed as homeless or threatened with homelessness in the year to September 2025.
This is a 2% reduction from the same period last year, but still means that a household becomes homeless in Scotland every 15 minutes.
Households assessed as homeless or threatened with homelessness in Scotland, 1st October 2017 to 30th September 2025
Homeless children in Scotland
In the year to September 2025, there were 14,371 children assessed as homeless.
This is the equivalent of 39 children in Scotland becoming homeless every day.
To prevent homelessness, we must fundamentally tackle Scotland’s housing emergency and fix the broken and biased housing system.
Read our strategy to find out how we’ll do this.
Data source: Scottish Government - Homelessness in Scotland: update to September 2025
Temporary accommodation
People have the right to temporary accommodation while the local authority makes a decision on their homeless application, and, if they're unintentionally homeless, until permanent accommodation is found.
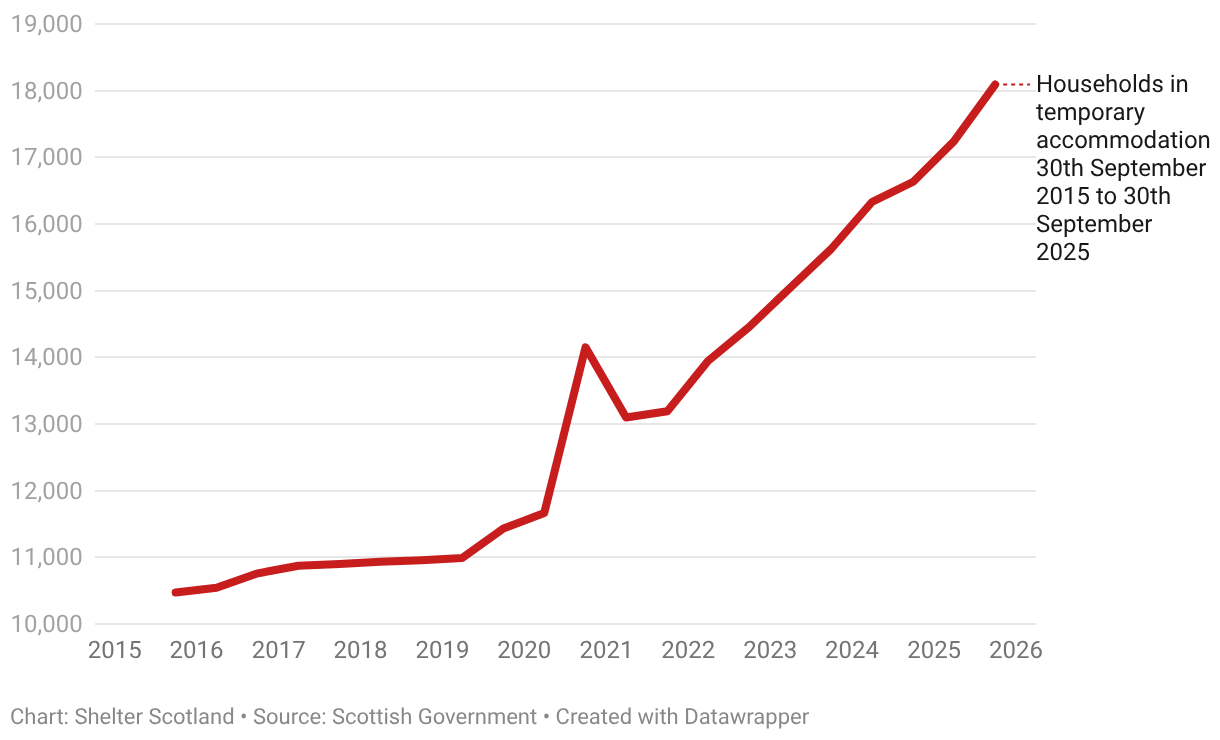
On 30th September 2025, there were 18,092 households trapped in temporary accommodation - a 9% increase on the previous year. This is the highest number on record.
10,567 households were living in temporary accommodation on 31st March 2015. Numbers rose steadily to 11,665 households in March 2020. During the pandemic figures increased sharply, to 14,151 households by 30th September 2020. There was a slight decrease by 2022, but since then the figure has sharply increased each year.
Households in temporary accommodation in Scotland, 30th September 2015 to 30th September 2025
Data source: Scottish Government - Homelessness in Scotland: update to September 2025
Children in temporary accommodation
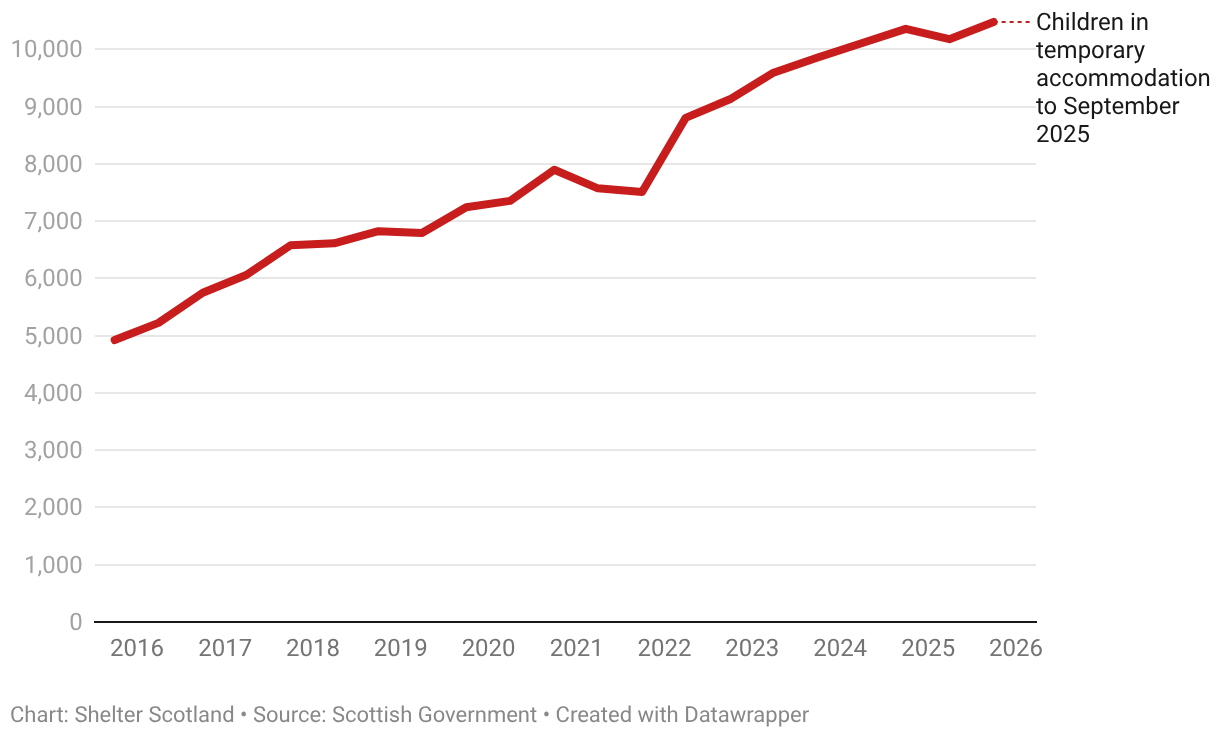
The latest statistics show that on 30th September 2025 there were 10,480 children living in temporary accommodation in Scotland.
This graph shows the trend of children in temporary accommodation in Scotland over time, from 2015 to 2025.
Children in temporary accommodation in Scotland, 30th September 2015 to 30th September 2025
Data source: Scottish Government - Homelessness in Scotland: update to September 2025
Households with children tend to spend longer in temporary accommodation than households without children.
In 2024/25, a couple in Scotland with children spent on average 386 days in temporary accommodation, compared to an average of 238 days for all household types.
The lack of affordable social homes in Scotland means there are not enough homes for people to move on from temporary accommodation. In particular, the lack of larger social homes means that households with children are stuck in temporary accommodation for longer.
The most effective way to address the bottleneck in temporary accommodation is to deliver the social homes we need, of the right types and in the right places. This should be a priority for the Scottish Government and local authorities.
Gatekeeping and unsuitable accommodation
We know that some people are not offered temporary accommodation when they are legally entitled to it, an experience known as ‘gatekeeping’. We also know that when temporary accommodation is offered, it is often legally unsuitable.
In the year to September 2025 there were at least 19,605 instances when a household was not offered temporary accommodation by their local authority when they had the right to it. This is an increase of 45% compared to September 2024.
There were also 7,240 reported cases of households being placed in temporary accommodation which was deemed by law to be 'unsuitable'. The Scottish Government has said that reporting on this issue is unreliable and this figure is likely to be an undercount.
This is unacceptable. People must be able to access their rights to temporary accommodation. This means that accommodation is made available when it's needed, that it meets the needs of the household and that it is of sufficiently good quality.
Local authorities must, at a bare minimum, deliver their statutory duties regarding temporary accommodation and be held to account for any breaches.
Data source: Scottish Government - Homelessness in Scotland: update to September 2025
Social housing
Scotland can achieve the structural change needed to end the housing emergency by ensuring everyone has a secure, warm, and safe home. This can only be done by delivering the social homes we need.
There are currently 125,000 households on local authority housing waiting lists across Scotland.
Data source: Scottish Government (2026) - Households in Scotland by housing tenure: Scottish Household Survey, 2024
Scotland needs to build a minimum of 15,693 social homes every year of the next parliament to tackle homelessness.
Read our Housing Delivery Plan 2026 for more information.
Affordable housing supply
The Affordable Housing Supply Programme (AHSP) statistics give us information on the supply of homes for social rent, affordable rent and affordable home ownership.
AHSP - All affordable tenures
This measure includes social homes, along with all other forms of affordable housing built under the AHSP.
Taken across the whole of 2025, the numbers are all down on the previous year:
approvals - 5833 (down 9% on 2024)
starts - 5856 (down 15% on 2024)
completions - 6289 (down 25% on 2024)
Social rent
During the year 2025/26, under the Affordable Housing Supply Programme:
5,338 homes for social rent were completed - a 9% decrease (556 fewer homes) compared to 24/25. This is
the lowest number of completions since 2020/216,242 homes for social rent were started a 39% increase (1758 more homes) compared to 24/25. This is
the highest number of starts since 2021/225,758 homes for social rent were approved - a 38% increase (1587 more homes) compared to 24/25. This is
the highest number of approvals since 2021/22
Data source: Scottish Government - Housing statistics annual update: new housebuilding and affordable housing supply to March 2026.
110,000 homes needed by 2032
In 2021, the Scottish Government committed to build 110,000 affordable homes by 2032. 5 years has passed, but the most recent statistics show that only 31,616 have been built, with 78,384 still outstanding.
As part of the Comprehensive Spending Review in January 2026, the Scottish Government said they would build 36,000 homes in the next 4 years. Even if they manage to do this, they would need to deliver 21,192 homes in both 2030/31 and 2031/32 to meet their long term target. Given this is almost double what has been managed in any previous year, this promise is also on track to be broken.
Shelter Scotland's own research shows 15,693 social homes must be built in each year of the next parliament to see homelessness begin to fall. We know what the consequences of this failure would be for communities we support, so our work to keep the pressure on is more vital than ever.
Last updated: 31 March 2026
Find out more about Shelter Scotland
Join our campaign to fight for home and end the devastating impact the housing emergency has on our communities.
Find out more about our campaigning work